The market is at record highs. Here is what the indicators underneath it are saying.
On Wednesday, the S&P 500 hit a new intraday all-time high, touching 7,382 before closing at 7,337. The NASDAQ followed it to a fresh record during the same session. First-quarter earnings across the S&P are running 27% ahead of the same period last year, according to FactSet data, the strongest growth since 2021. By almost every headline measure, the equity market is telling investors that conditions are good and the good times are extending.
Experienced investors have heard that story before. And they know it tends to arrive alongside a number worth paying close attention to.
The number behind the headlines
The Buffett Indicator, the ratio of total US stock market capitalisation to GDP, currently stands at 227%. In 2001, Warren Buffett wrote in Fortune that when this ratio approached 200%, investors were "playing with fire." That warning was issued when the ratio was at 200%. It is now roughly one-sixth higher than that threshold.
The logic behind the indicator is not complicated. Buffett's thesis is that corporate earnings, over time, cannot indefinitely outpace the broader economy. Markets can diverge from GDP growth for extended periods, but the further they diverge, the more forcefully they tend to revert. As Fortune reported in April 2026, corporate profits are now running at 12% of US GDP, against a historic average of 7% to 8%. The S&P 500's price-to-earnings ratio, based on forecast Q1 GAAP earnings, exceeds 28, against a 100-year average of around 17.
The Buffett Indicator does not tell you when a correction arrives. It never has. What it does tell you is that valuations are at levels from which meaningful drawdowns have historically followed. When the indicator reached 200% during the dot-com peak in 2000, the S&P fell by roughly half in the years that followed. When it exceeded 200% again in November 2021, the S&P fell 19% before recovering. At 227%, the indicator is in territory it has never reached before.
The broader backdrop adds further texture. JPMorgan CEO Jamie Dimon warned last week that rising government debt levels could trigger "some kind of bond crisis" if policymakers fail to act proactively. The 30-year US Treasury yield has been testing the 5% level, a threshold that has historically preceded equity market volatility. The Federal Reserve held rates at its April 29 meeting, with four officials dissenting, the most since 1992. Core PCE inflation came in at 3.2% in March, its highest level since November 2023. And US consumer sentiment has fallen to a record low, even as equity indices reach record highs. The gap between what markets are pricing and what the underlying economy feels like has rarely been wider.
When the conversation shifts from growth to preservation
For much of the past decade, the dominant question among investors has been where to find the best returns. That question reflects an environment of relatively low risk, relatively cheap money, and broadly rising asset prices.
When valuations are elevated, inflation is persistent, and the indicators that have historically preceded major corrections are flashing, the question changes. It becomes: how do I protect what I have built?
Capital preservation is not pessimism. It does not mean withdrawing from markets or converting portfolios to cash. It means allocating deliberately across assets whose behaviour in a downturn is structurally different from the equity market, so that a correction in one part of a portfolio does not compress the whole.
The challenge is that most assets which appear diversified are not truly uncorrelated. In a genuine equity sell-off, correlations between asset classes tend to rise. The assets that hold their ground are those whose value derives from something other than financial market sentiment: physical scarcity, cultural significance, and finite supply that does not respond to a central bank meeting or an earnings miss.
What the historical data shows
The table below compares the Liv-ex 1000, the broadest measure of the fine wine market, against major global equity indices and gold across three measures: volatility, correlation to the Liv-ex 1000, and maximum one-year rolling drawdown. The data covers 2004 to 2026.
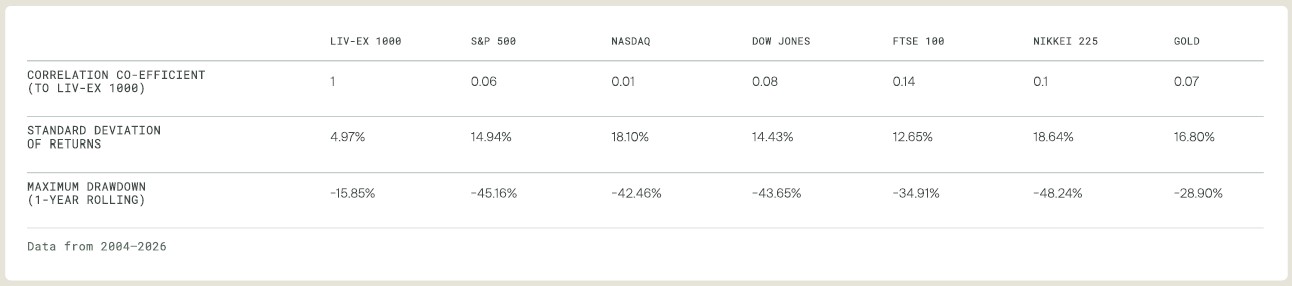
The numbers that stand out are not the returns. They are the drawdowns. Over the same period that the S&P 500 experienced a maximum one-year rolling drawdown of 45.16%, the NASDAQ 42.46%, and the Nikkei 48.24%, the Liv-ex 1000's maximum one-year rolling drawdown was 15.85%. Roughly a third of what equity investors absorbed during the worst periods.
The correlation figures matter equally. The S&P 500's correlation to the Liv-ex 1000 over this period is 0.06. The NASDAQ's is 0.01. These asset classes do not tend to move together. When equity markets fell hardest, investment-grade fine wine did not follow.
What capital preservation looks like in practice
Fine wine is not the only category with these characteristics. A brief look at the alternatives that have historically exhibited capital-preserving qualities is useful context.
Gold has the longest track record as a store of value in periods of financial stress. Its maximum one-year rolling drawdown over the same period was 28.90%, meaningfully lower than equities, though higher than fine wine. Its correlation to the Liv-ex 1000 is 0.07. Gold's limitation is that its value is almost entirely sentiment-driven. And having risen 42% in the last 12 months alone, upside potential vs. downside risk plays a big role in it's ability to offer a hedge vs. rising equities.
Fine art had its strongest year across the passion asset categories in 2025, with Impressionist works up 13.6% and modern art up 7.1% by Knight Frank's measure. The Art Basel and UBS Global Art Market Report recorded global art sales rising 4% to $59.6 billion in 2025, with US auction sales up 23% year on year, the first annual growth since 2022. Its low correlation to public markets and cultural staying power give it a genuine role in a diversified portfolio. The practical limitations are liquidity and access: trophy works trade in deep, competitive markets, while the mid-market can be slow and opaque. For those already active in the space, it is a serious asset class. For those new to it, entry point and category selection matter considerably more than in more transparent markets.
Luxury watches continued to hold value in 2025, with the Knight Frank sub-index up 5.1%, driven by sustained demand for a small number of Patek Philippe and Rolex references. Watches offer better liquidity than art and a relatively transparent secondary market. The investment case is however concentrated in a narrow set of references, and specific categories have shown meaningful volatility in recent years.
Investment-grade fine wine sits differently within this group. It has a credible, independently published benchmark in the Liv-ex 1000, a functioning global secondary market, and the structural characteristic of a supply that only ever falls. Every bottle consumed permanently reduces what remains available. That scarcity is not manufactured or trend-dependent. It is simply the nature of a physical asset produced in fixed quantities in a specific place, in a specific year, once.
There is also a valuation point worth noting. Equities are at all-time highs with the Buffett Indicator at 227%. The Liv-ex 1000 has corrected roughly 25% to 30% from its own 2022 peak, and has been recovering steadily since August 2025. An asset class entering a period of potential equity market uncertainty from a position of already-reset valuations is not the same proposition as one entering it from record highs.
The honest caveat is important. Investment-grade fine wine is not a liquid asset in the way that equities or gold are. The secondary market functions well, but it does not offer the same speed of exit as a public market. Investors considering fine wine as part of a capital preservation strategy should approach it with a minimum time horizon of three to five years. It is not the right instrument for capital that may need to be redeployed quickly. For those with a medium to long-term perspective, an equity-heavy portfolio, and a genuine interest in how tangible assets behave through cycles, its combination of low correlation, controlled drawdowns, and structural scarcity gives it a specific and defensible place.
The outlook
Nobody knows when the Buffett Indicator reverts. That was true at 200% in 2000, and true again when it exceeded 200% in 2021. What the historical record does tell us is that indicators at 227% do not remain there indefinitely, and that the assets which perform best through a correction are typically those whose value is not dependent on the same growth expectations as the market that is correcting.
Capital preservation is not a prediction about what markets will do. It is a discipline about how portfolios are built. The investors who navigate major corrections most effectively are generally those who thought about architecture during the good times, not after conditions changed.
If you want to understand how fine wine fits within a broader investment portfolio, and what the current environment means for your own allocation, explore Savea's wealth calculator at www.savea.com.
Also worth reading: How India's landmark trade deal with the EU is creating a structural tailwind for the fine wine market.
